bundles / scipy latest / scipy / signal / _signaltools / detrend
function
scipy.signal._signaltools:detrend
Signature
def detrend ( data : np.ndarray , axis : int = -1 , type : Literal['linear', 'constant'] = linear , bp : ArrayLike | int = 0 , overwrite_data : bool = False ) → np.ndarray Summary
Remove linear or constant trend along axis from data.
Parameters
data: array_likeThe input data.
axis: int, optionalThe axis along which to detrend the data. By default this is the last axis (-1).
type: {'linear', 'constant'}, optionalThe type of detrending. If
type == 'linear'(default), the result of a linear least-squares fit todatais subtracted fromdata. Iftype == 'constant', only the mean ofdatais subtracted.bp: array_like of ints, optionalA sequence of break points. If given, an individual linear fit is performed for each part of
databetween two break points. Break points are specified as indices intodata. This parameter only has an effect whentype == 'linear'.overwrite_data: bool, optionalIf True, allow in place detrending and avoid a copy. Default is False. In place modification applies only if
type == 'linear'anddatais of the floating point dtypefloat32,float64,complex64orcomplex128.
Returns
ret: ndarrayThe detrended input data.
Notes
Detrending can be interpreted as subtracting a least squares fit polynomial: Setting the parameter type to 'constant' corresponds to fitting a zeroth degree polynomial, 'linear' to a first degree polynomial. Consult the example below.
Array API Standard Support
detrend has experimental support for Python Array API Standard compatible backends in addition to NumPy. Please consider testing these features by setting an environment variable SCIPY_ARRAY_API=1 and providing CuPy, PyTorch, JAX, or Dask arrays as array arguments. The following combinations of backend and device (or other capability) are supported.
====================  ====================  ====================
Library               CPU                   GPU
====================  ====================  ====================
NumPy                 ✅                     n/a
CuPy                  n/a                   ✅
PyTorch               ✅                     ⛔
JAX                   ✅                     ✅
Dask                  ⚠️ computes graph     n/a
====================  ====================  ====================
See
dev-arrayapifor more information.
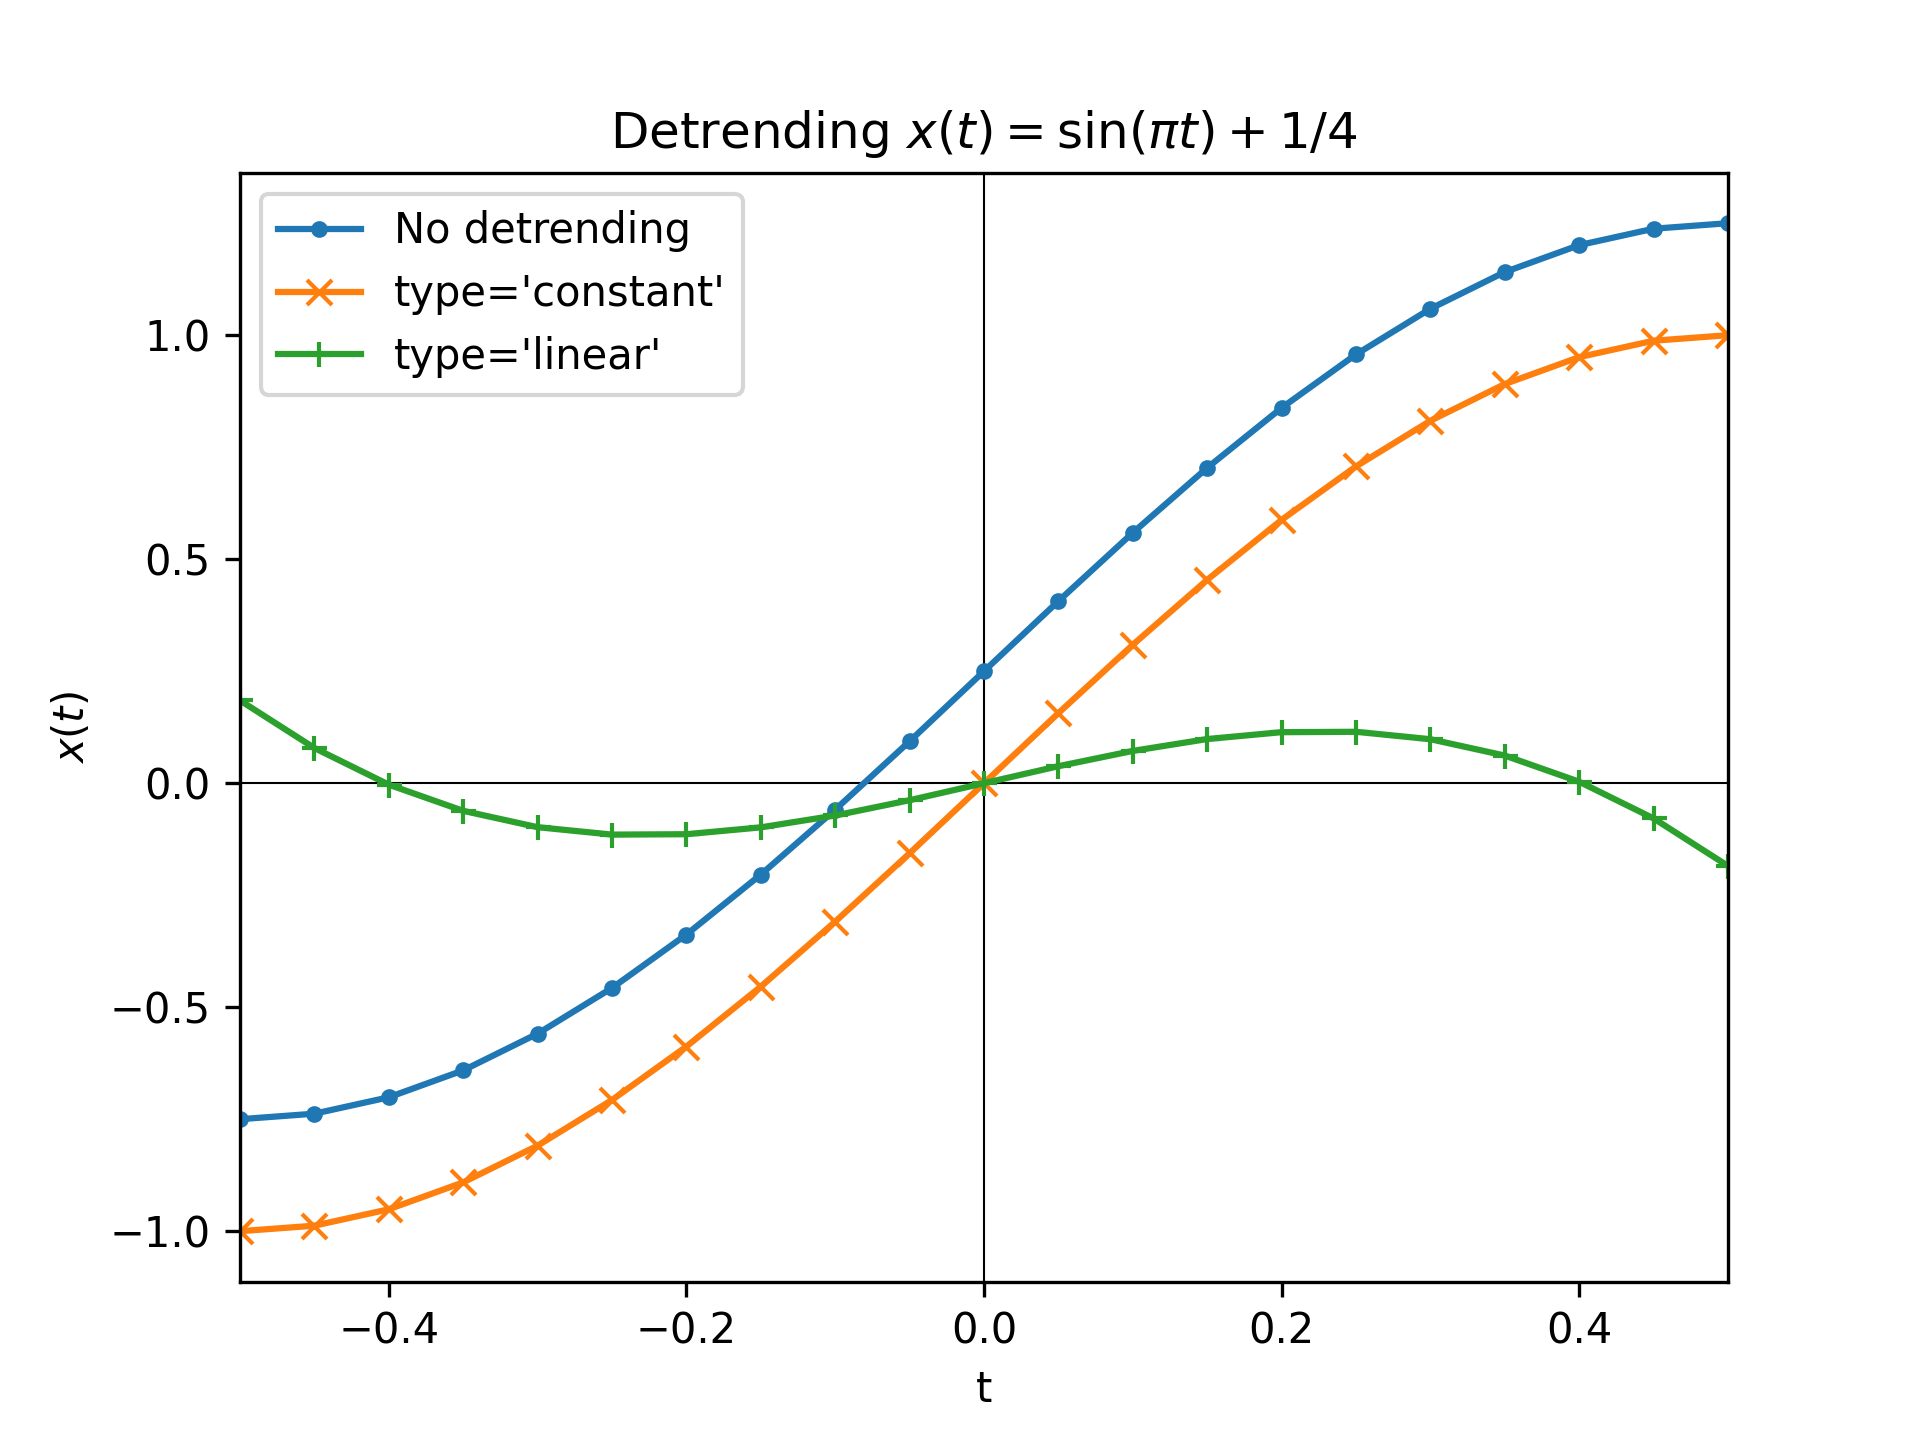
Examples
The following example detrends the function :math:`x(t) = \sin(\pi t) + 1/4`:import matplotlib.pyplot as plt import numpy as np from scipy.signal import detrend t = np.linspace(-0.5, 0.5, 21) x = np.sin(np.pi*t) + 1/4 x_d_const = detrend(x, type='constant') x_d_linear = detrend(x, type='linear') fig1, ax1 = plt.subplots()✓
ax1.set_title(r"Detrending $x(t)=\sin(\pi t) + 1/4$")
ax1.set(xlabel="t", ylabel="$x(t)$", xlim=(t[0], t[-1]))
ax1.axhline(y=0, color='black', linewidth=.5)
ax1.axvline(x=0, color='black', linewidth=.5)
ax1.plot(t, x, 'C0.-',  label="No detrending")
ax1.plot(t, x_d_const, 'C1x-', label="type='constant'")
ax1.plot(t, x_d_linear, 'C2+-', label="type='linear'")
ax1.legend()
✗
plt.show()
✓
pp0 = np.polynomial.Polynomial.fit(t, x, deg=0)  # fit degree 0 polynomial
np.allclose(x_d_const, x - pp0(t))  # compare with constant detrend
pp1 = np.polynomial.Polynomial.fit(t, x, deg=1)  # fit degree 1 polynomial
np.allclose(x_d_linear, x - pp1(t))  # compare with linear detrend
✓
See also
- numpy.polynomial.polynomial.Polynomial.fit
Create least squares fit polynomial.
Aliases
-
scipy.signal.detrend