bundles / scipy latest / scipy / signal / _signaltools / sosfilt_zi
function
scipy.signal._signaltools:sosfilt_zi
Signature
def sosfilt_zi ( sos ) Summary
Construct initial conditions for sosfilt for step response steady-state.
Extended Summary
Compute an initial state zi for the sosfilt function that corresponds to the steady state of the step response.
A typical use of this function is to set the initial state so that the output of the filter starts at the same value as the first element of the signal to be filtered.
Parameters
sos: array_likeArray of second-order filter coefficients, must have shape
(n_sections, 6). See sosfilt for the SOS filter format specification.
Returns
zi: ndarrayInitial conditions suitable for use with
sosfilt, shape(n_sections, 2).
Notes
Array API Standard Support
sosfilt_zi has experimental support for Python Array API Standard compatible backends in addition to NumPy. Please consider testing these features by setting an environment variable SCIPY_ARRAY_API=1 and providing CuPy, PyTorch, JAX, or Dask arrays as array arguments. The following combinations of backend and device (or other capability) are supported.
====================  ====================  ====================
Library               CPU                   GPU
====================  ====================  ====================
NumPy                 ✅                     n/a
CuPy                  n/a                   ✅
PyTorch               ✅                     ✅
JAX                   ✅                     ✅
Dask                  ✅                     n/a
====================  ====================  ====================
See
dev-arrayapifor more information.
Examples
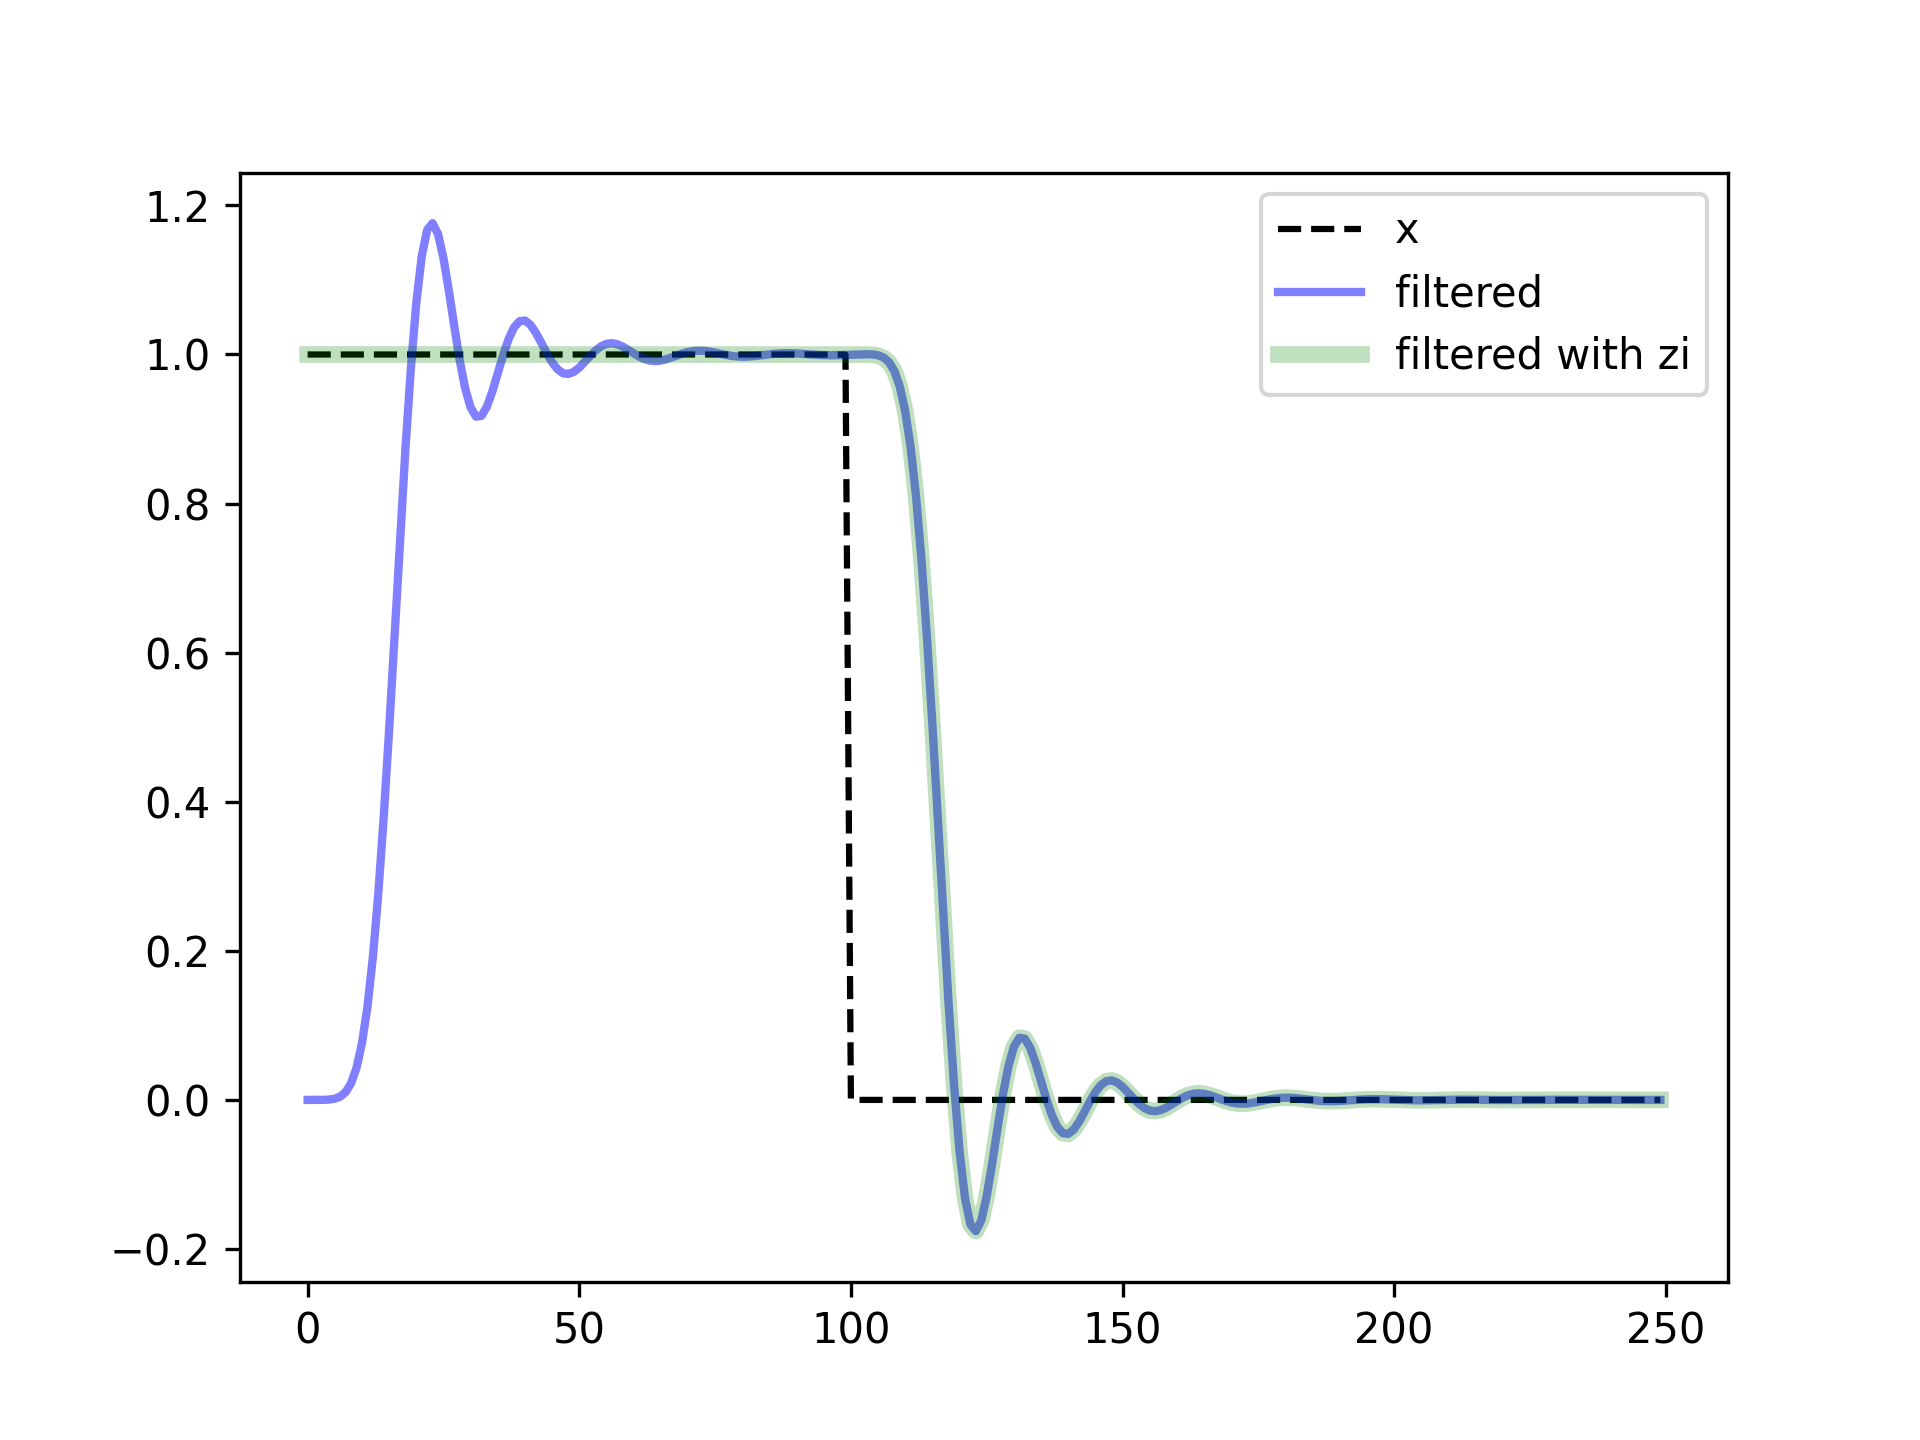
Filter a rectangular pulse that begins at time 0, with and without the use of the `zi` argument of `scipy.signal.sosfilt`.import numpy as np from scipy import signal import matplotlib.pyplot as plt✓
sos = signal.butter(9, 0.125, output='sos')
zi = signal.sosfilt_zi(sos)
x = (np.arange(250) < 100).astype(int)
f1 = signal.sosfilt(sos, x)
f2, zo = signal.sosfilt(sos, x, zi=zi)
✓
plt.plot(x, 'k--', label='x')
plt.plot(f1, 'b', alpha=0.5, linewidth=2, label='filtered')
plt.plot(f2, 'g', alpha=0.25, linewidth=4, label='filtered with zi')
plt.legend(loc='best')
✗
plt.show()
✓
See also
Aliases
-
scipy.signal.sosfilt_zi