bundles / scipy latest / scipy / signal / _signaltools / resample_poly
function
scipy.signal._signaltools:resample_poly
Signature
def resample_poly ( x , up , down , axis = 0 , window = ('kaiser', 5.0) , padtype = constant , cval = None ) Summary
Resample x along the given axis using polyphase filtering.
Extended Summary
The signal x is upsampled by the factor up, a zero-phase low-pass FIR filter is applied, and then it is downsampled by the factor down. The resulting sample rate is up / down times the original sample rate. By default, values beyond the boundary of the signal are assumed to be zero during the filtering step.
Parameters
x: array_likeThe data to be resampled.
up: intThe upsampling factor.
down: intThe downsampling factor.
axis: int, optionalThe axis of
xthat is resampled. Default is 0.window: string, tuple, or array_like, optionalDesired window to use to design the low-pass filter, or the FIR filter coefficients to employ. See below for details.
padtype: string, optionalconstant,line,mean,median, maximum, minimum or any of the other signal extension modes supported by scipy.signal.upfirdn. Changes assumptions on values beyond the boundary. Ifconstant, assumed to becval(default zero). Iflineassumed to continue a linear trend defined by the first and last points.mean,median, maximum and minimum work as innp.padand assume that the values beyond the boundary are the mean, median, maximum or minimum respectively of the array along the axis.cval: float, optionalValue to use if
padtype='constant'. Default is zero.
Returns
resampled_x: arrayThe resampled array.
Notes
This polyphase method will likely be faster than the Fourier method in scipy.signal.resample when the number of samples is large and prime, or when the number of samples is large and up and down share a large greatest common denominator. The length of the FIR filter used will depend on max(up, down) // gcd(up, down), and the number of operations during polyphase filtering will depend on the filter length and down (see scipy.signal.upfirdn for details).
The argument window specifies the FIR low-pass filter design.
If window is an array_like it is assumed to be the FIR filter coefficients. Note that the FIR filter is applied after the upsampling step, so it should be designed to operate on a signal at a sampling frequency higher than the original by a factor of up//gcd(up, down). This function's output will be centered with respect to this array, so it is best to pass a symmetric filter with an odd number of samples if, as is usually the case, a zero-phase filter is desired.
For any other type of window, the functions scipy.signal.get_window and scipy.signal.firwin are called to generate the appropriate filter coefficients.
The first sample of the returned vector is the same as the first sample of the input vector. The spacing between samples is changed from dx to dx * down / float(up).
Array API Standard Support
resample_poly has experimental support for Python Array API Standard compatible backends in addition to NumPy. Please consider testing these features by setting an environment variable SCIPY_ARRAY_API=1 and providing CuPy, PyTorch, JAX, or Dask arrays as array arguments. The following combinations of backend and device (or other capability) are supported.
====================  ====================  ====================
Library               CPU                   GPU
====================  ====================  ====================
NumPy                 ✅                     n/a
CuPy                  n/a                   ✅
PyTorch               ✅                     ⛔
JAX                   ⚠️ no JIT             ⛔
Dask                  ⛔                     n/a
====================  ====================  ====================
CuPy only supports padtype="constant".
See
dev-arrayapifor more information.
Examples
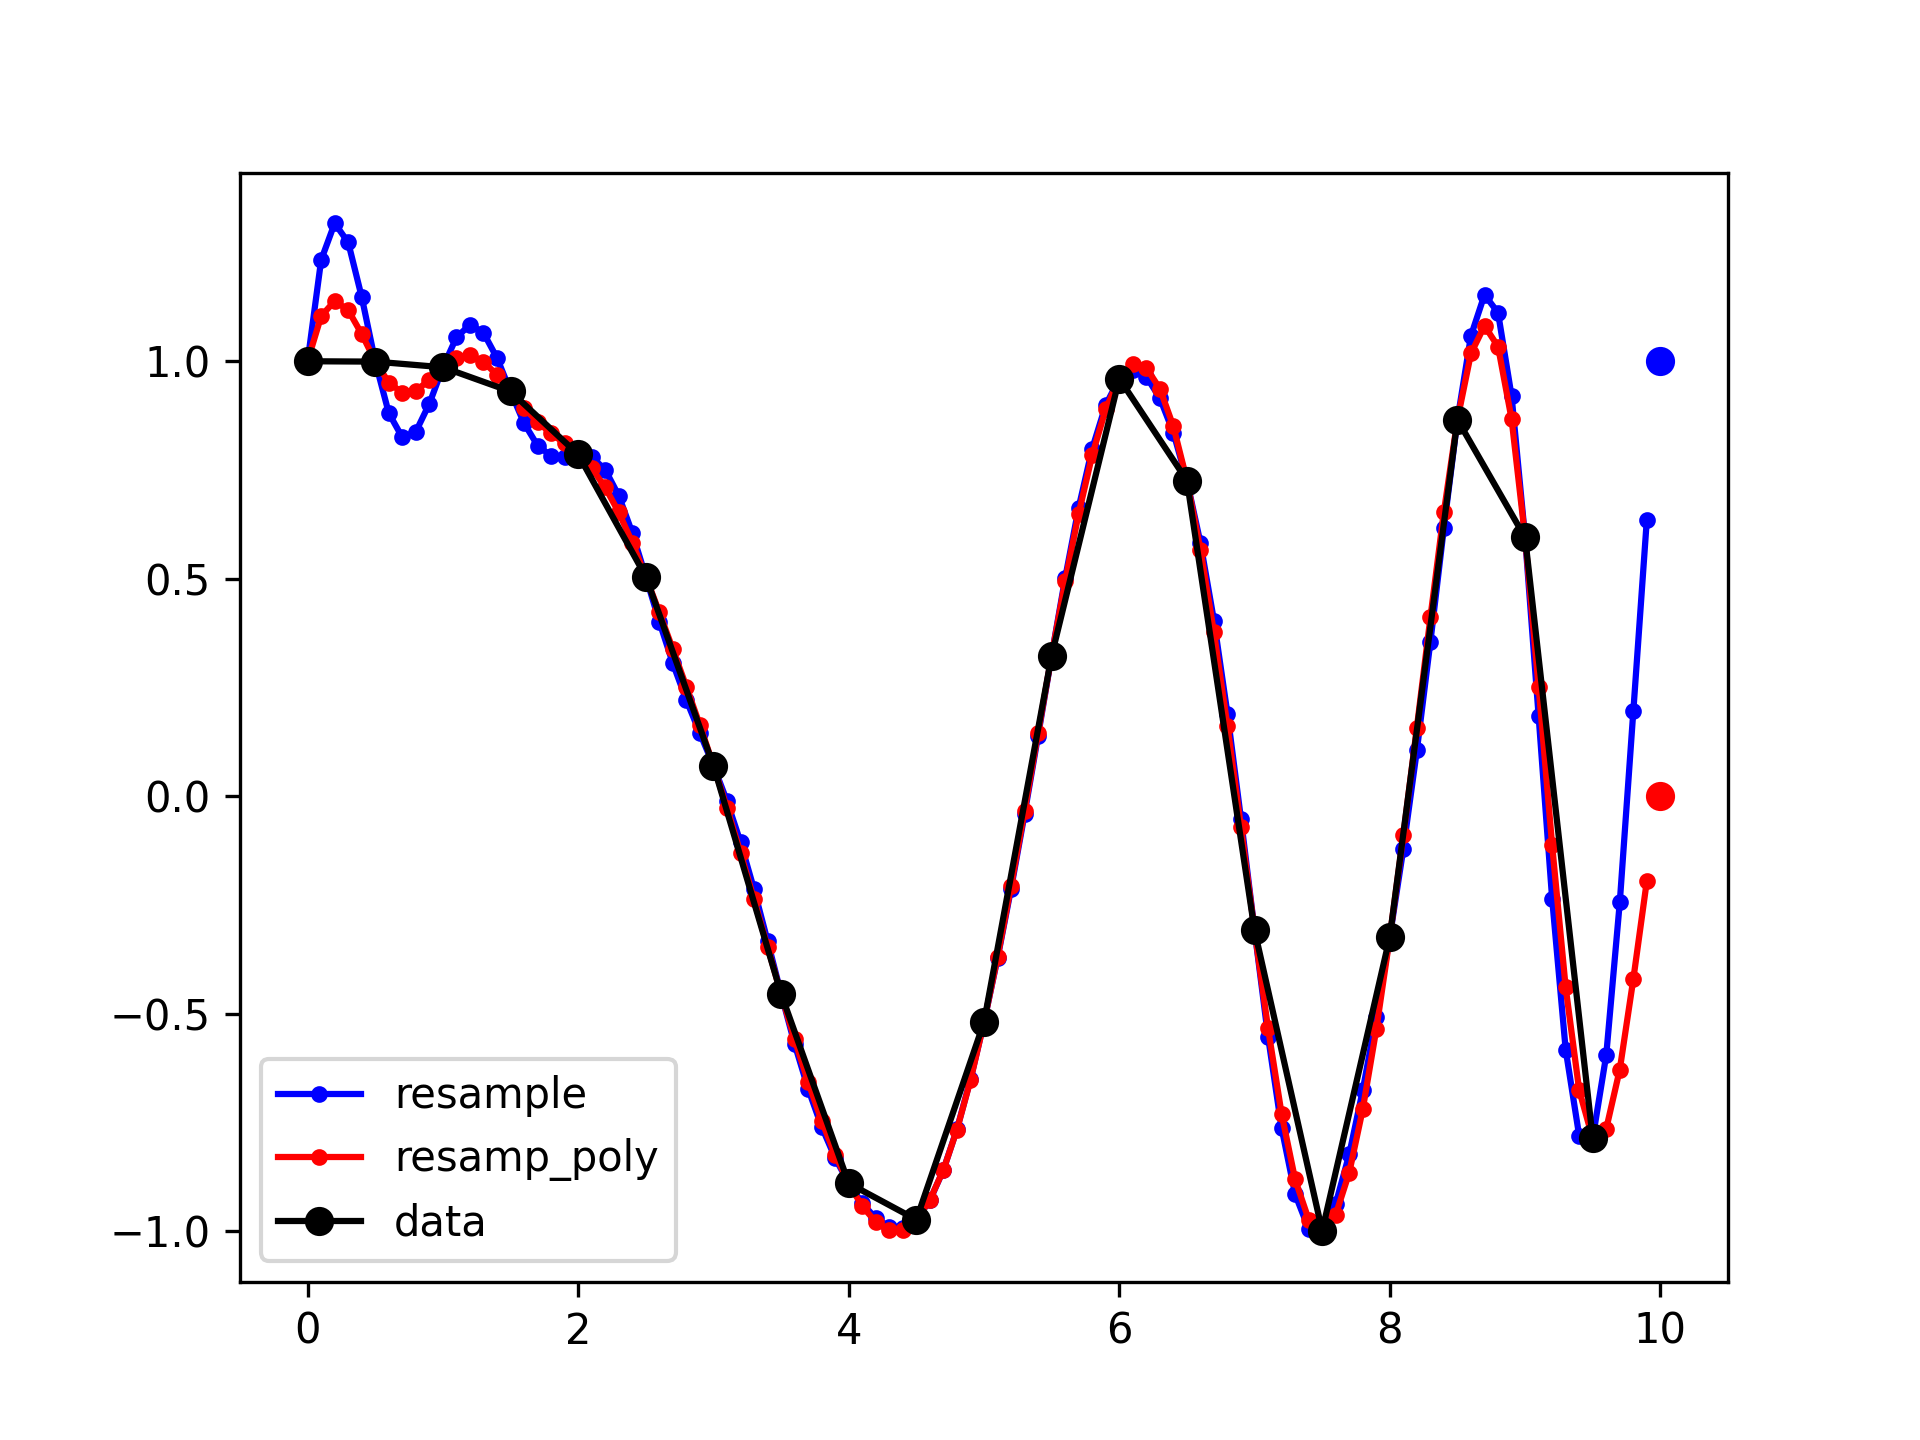
By default, the end of the resampled data rises to meet the first sample of the next cycle for the FFT method, and gets closer to zero for the polyphase method:import numpy as np from scipy import signal import matplotlib.pyplot as plt✓
x = np.linspace(0, 10, 20, endpoint=False)
y = np.cos(-x**2/6.0)
f_fft = signal.resample(y, 100)
f_poly = signal.resample_poly(y, 100, 20)
xnew = np.linspace(0, 10, 100, endpoint=False)
✓
plt.plot(xnew, f_fft, 'b.-', xnew, f_poly, 'r.-')
plt.plot(x, y, 'ko-')
plt.plot(10, y[0], 'bo', 10, 0., 'ro')  # boundaries
plt.legend(['resample', 'resamp_poly', 'data'], loc='best')
✗
plt.show()
✓
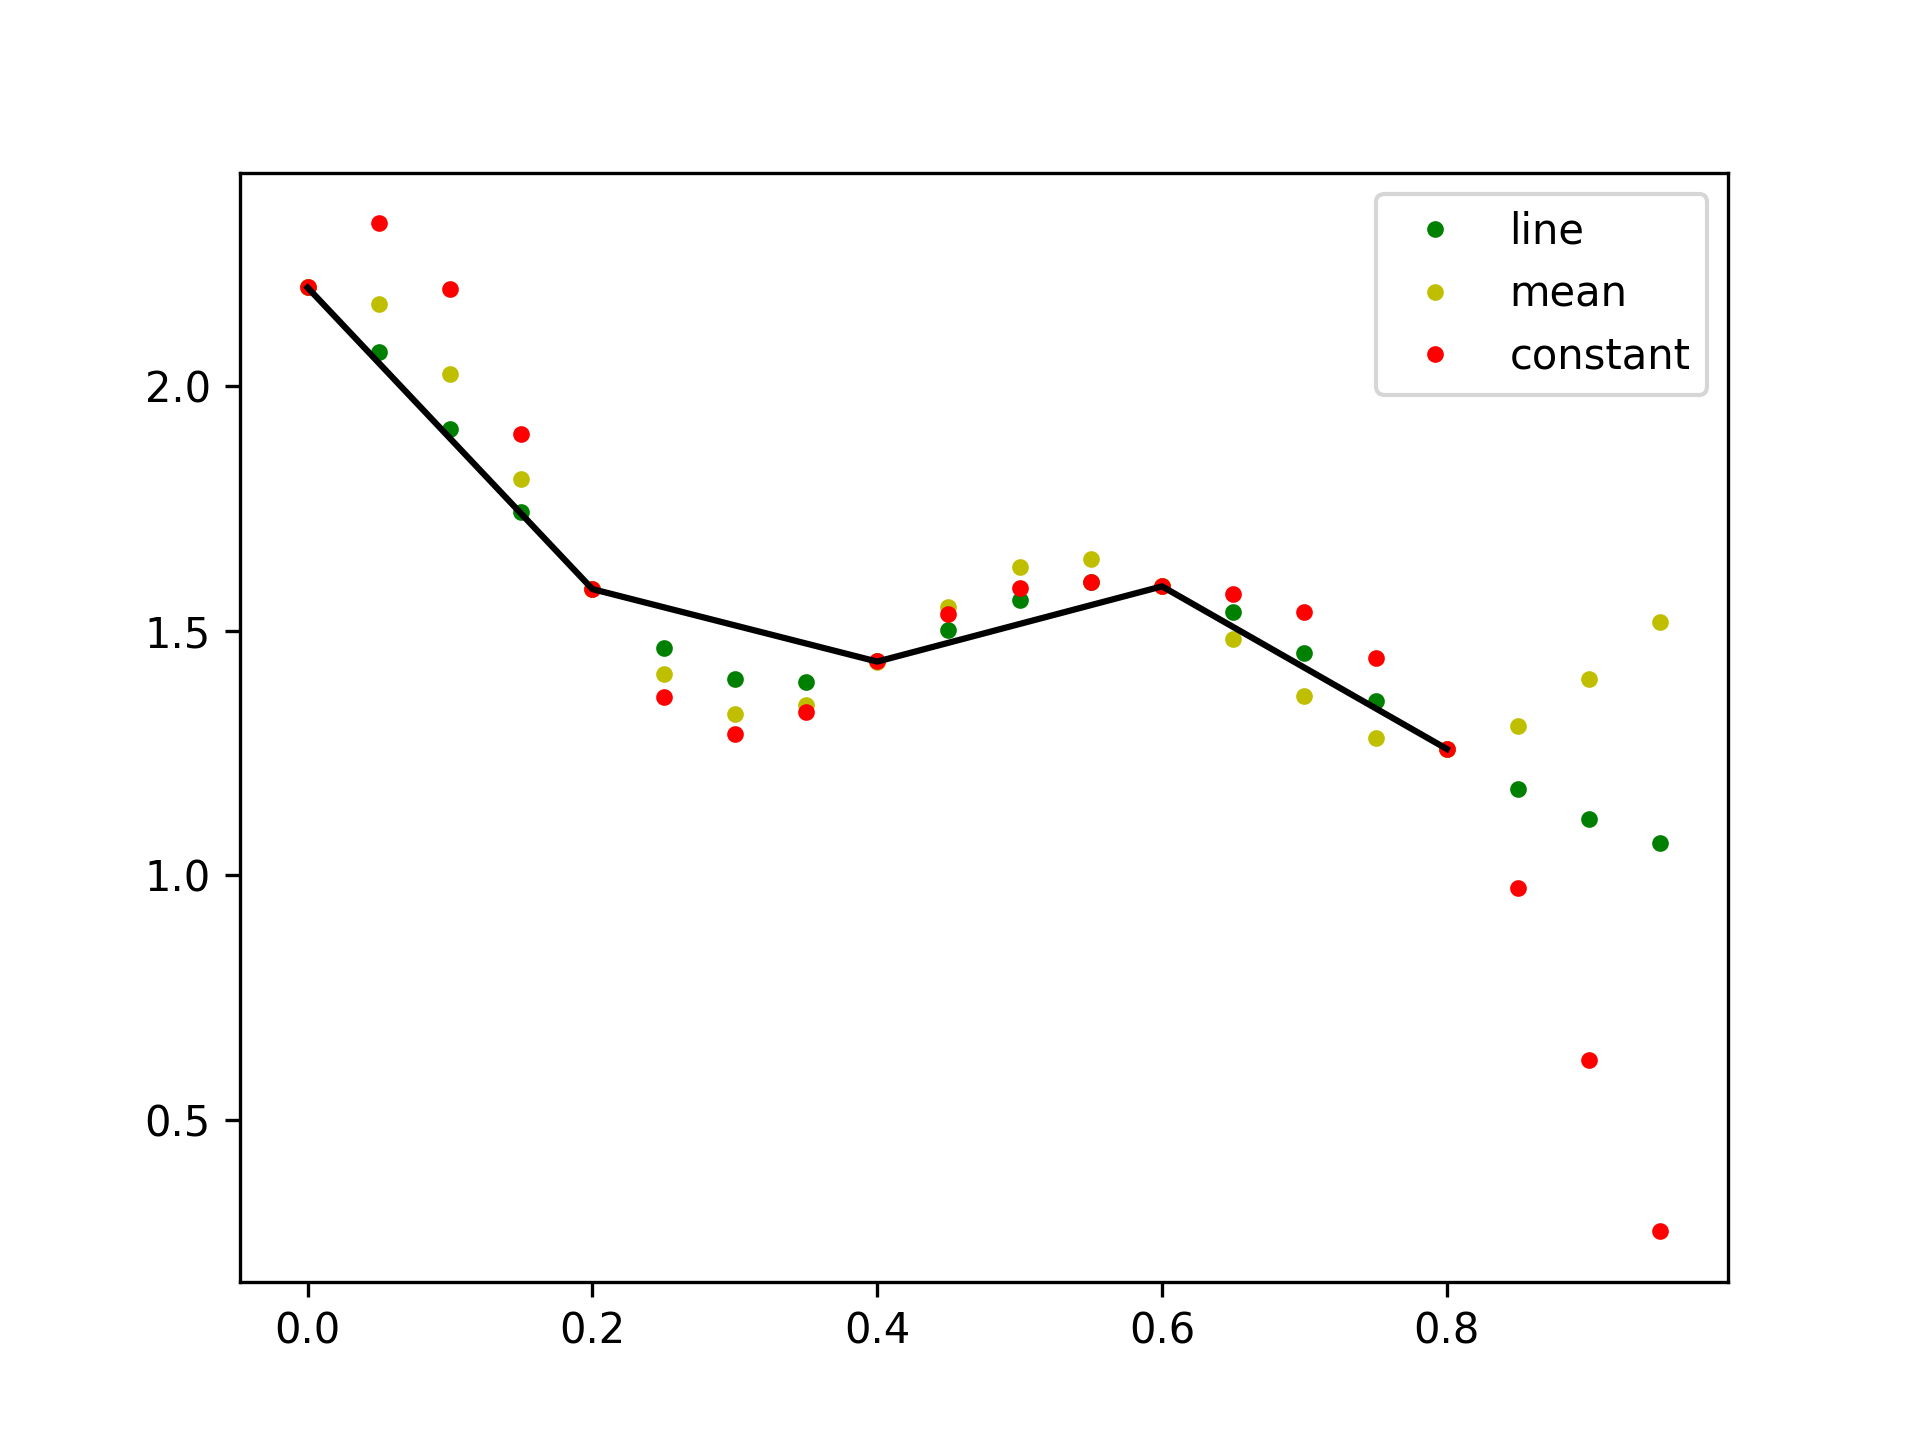
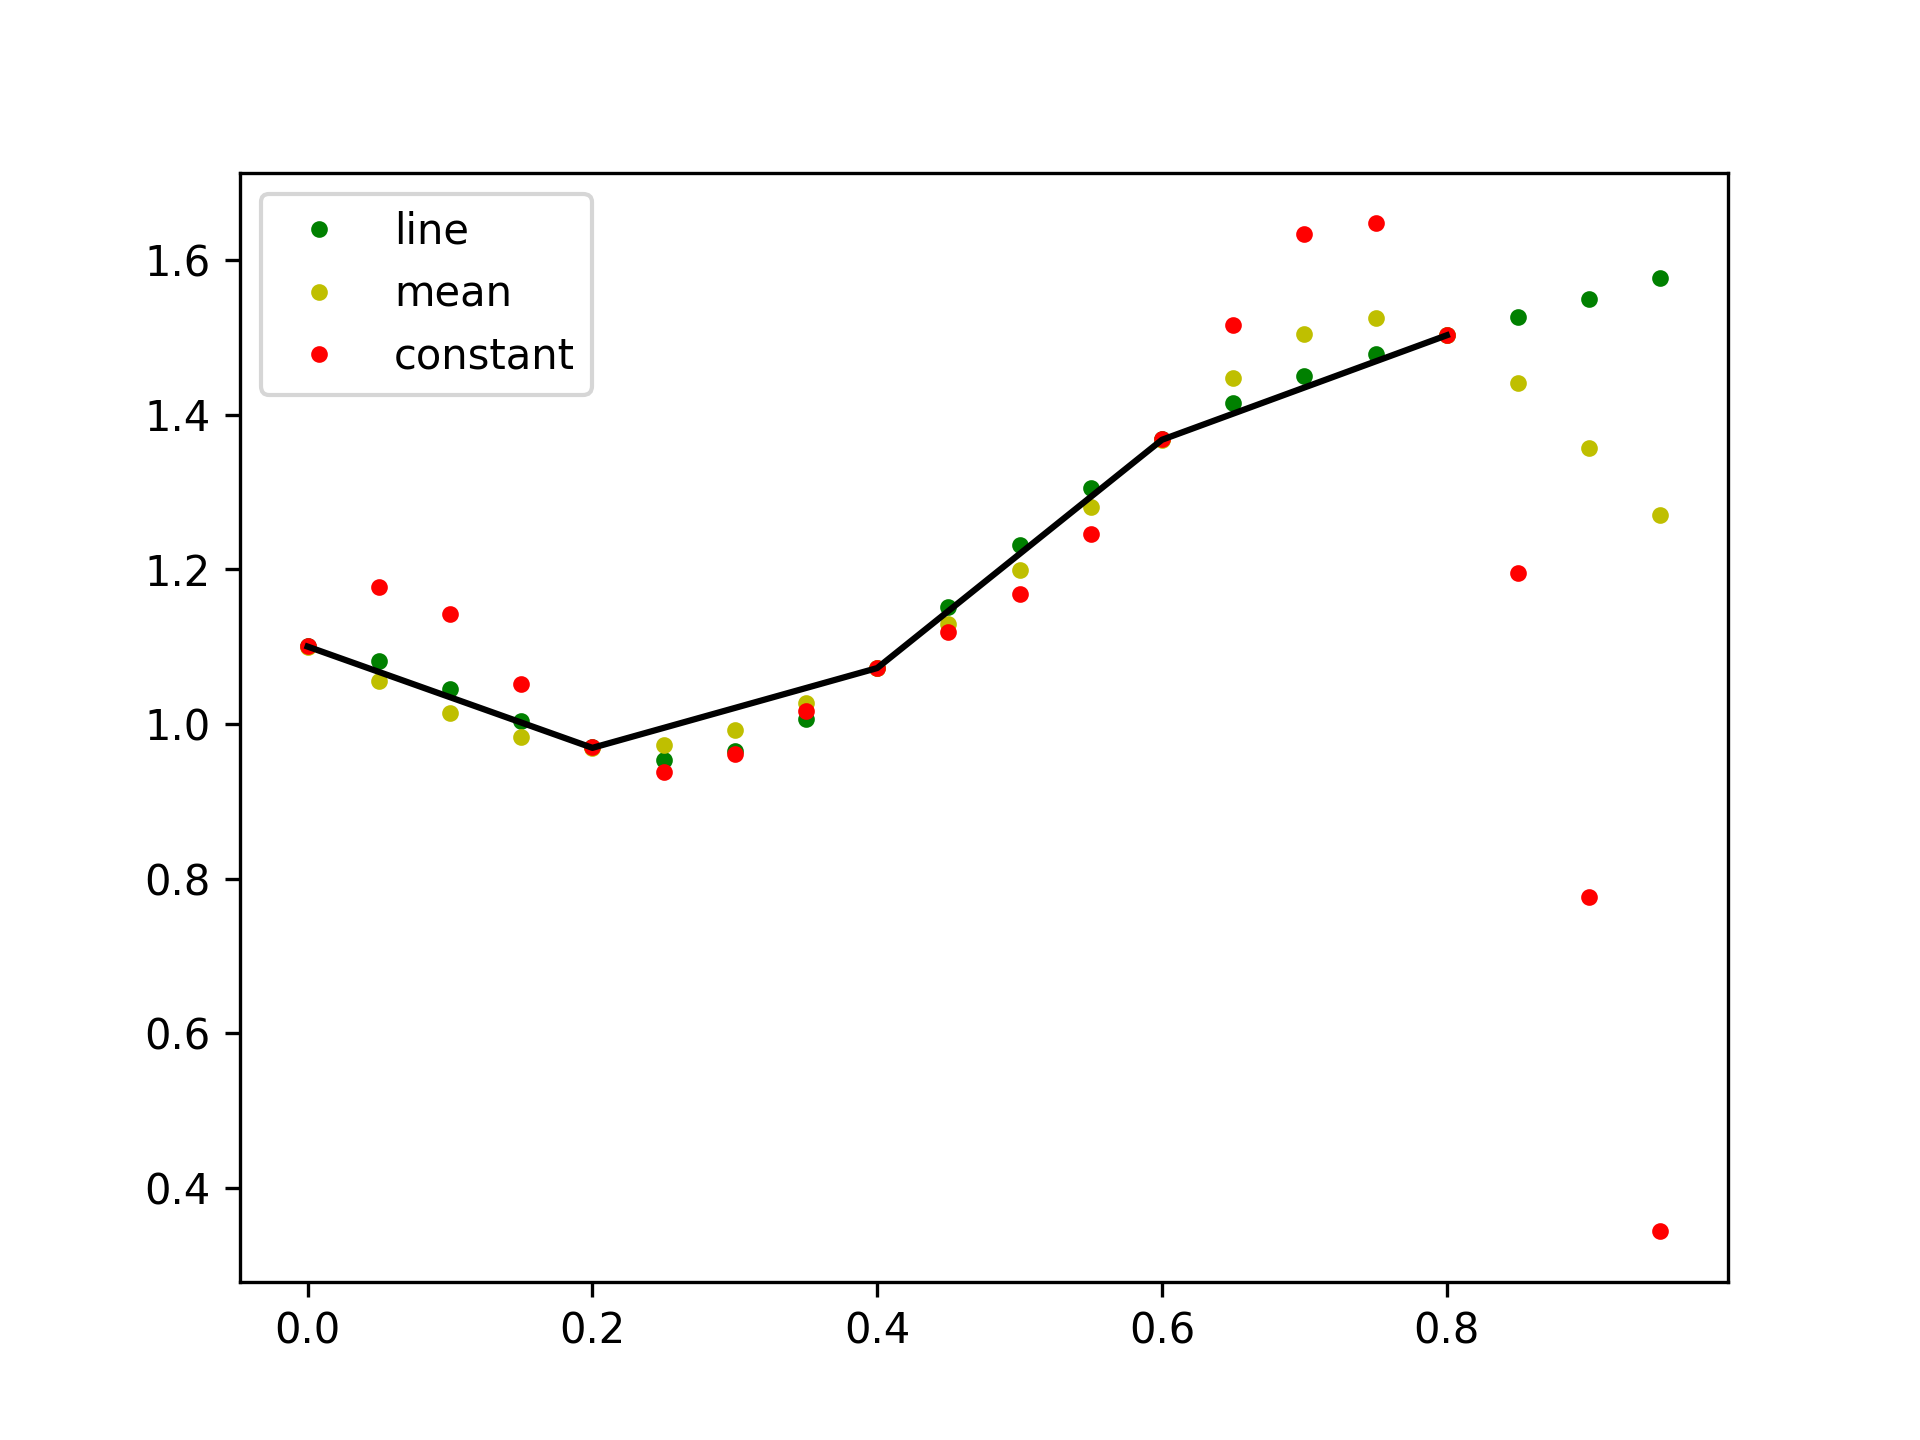
N = 5
x = np.linspace(0, 1, N, endpoint=False)
y = 2 + x**2 - 1.7*np.sin(x) + .2*np.cos(11*x)
y2 = 1 + x**3 + 0.1*np.sin(x) + .1*np.cos(11*x)
Y = np.stack([y, y2], axis=-1)
up = 4
xr = np.linspace(0, 1, N*up, endpoint=False)
✓
y2 = signal.resample_poly(Y, up, 1, padtype='constant')
y3 = signal.resample_poly(Y, up, 1, padtype='mean')
y4 = signal.resample_poly(Y, up, 1, padtype='line')
✓
for i in [0,1]:
    plt.figure()
    plt.plot(xr, y4[:,i], 'g.', label='line')
    plt.plot(xr, y3[:,i], 'y.', label='mean')
    plt.plot(xr, y2[:,i], 'r.', label='constant')
    plt.plot(x, Y[:,i], 'k-')
    plt.legend()
✗
plt.show()
✓
See also
- decimate
Downsample the signal after applying an FIR or IIR filter.
- resample
Resample up or down using the FFT method.
Aliases
-
scipy.signal.resample_poly