bundles / scipy latest / scipy / signal / _signaltools / vectorstrength
function
scipy.signal._signaltools:vectorstrength
source: build-install/usr/lib/python3.14/site-packages/scipy/signal/_signaltools.py:4225
Signature
def vectorstrength(events, period)Summary
Determine the vector strength of the events corresponding to the given period.
Extended Summary
The vector strength is a measure of phase synchrony, how well the timing of the events is synchronized to a single period of a periodic signal.
If multiple periods are used, calculate the vector strength of each. This is called the "resonating vector strength".
Parameters
events: 1D array_likeAn array of time points containing the timing of the events.
period: float or array_likeThe period of the signal that the events should synchronize to. The period is in the same units as
events. It can also be an array of periods, in which case the outputs are arrays of the same length.
Returns
strength: float or 1D arrayThe strength of the synchronization. 1.0 is perfect synchronization and 0.0 is no synchronization. If
periodis an array, this is also an array with each element containing the vector strength at the corresponding period.phase: float or arrayThe phase that the events are most strongly synchronized to in radians. If
periodis an array, this is also an array with each element containing the phase for the corresponding period.
Examples
In this example, five events occur exactly 1 second apart, starting at 0.25 s. The vector strength is 1 for ``period=1`` because all events fall at the same phase of every cycle, and the returned phase is π/2, a quarter of the way through the period.import numpy as np from scipy.signal import vectorstrength events = np.array([0.25, 1.25, 2.25, 3.25, 4.25])✓
vectorstrength(events, period=1.0)
✗(np.float64(1.0), np.float64(1.5707963267948968))``period`` can also be an array of candidate periods. With the same events as above, the strength stays at 1 at the true period of 1 s and at the sub-multiple period 0.5 s (a form of aliasing), and drops to 0 at ``period=5`` where the events span a single period at evenly-spaced phases:
periods = [1, 5, 0.5]
strengths, phases = vectorstrength(events, periods)
for p_, s_, ph_ in zip(periods, strengths, phases):
    print(f"period = {p_:.1f}: strength = {s_:.2f}, "
          f"phase = {np.rad2deg(ph_):.1f} deg")
✓
period = 1.0: strength = 1.00, phase = 90.0 deg
period = 5.0: strength = 0.00, phase = 153.4 deg
period = 0.5: strength = 1.00, phase = -180.0 deg
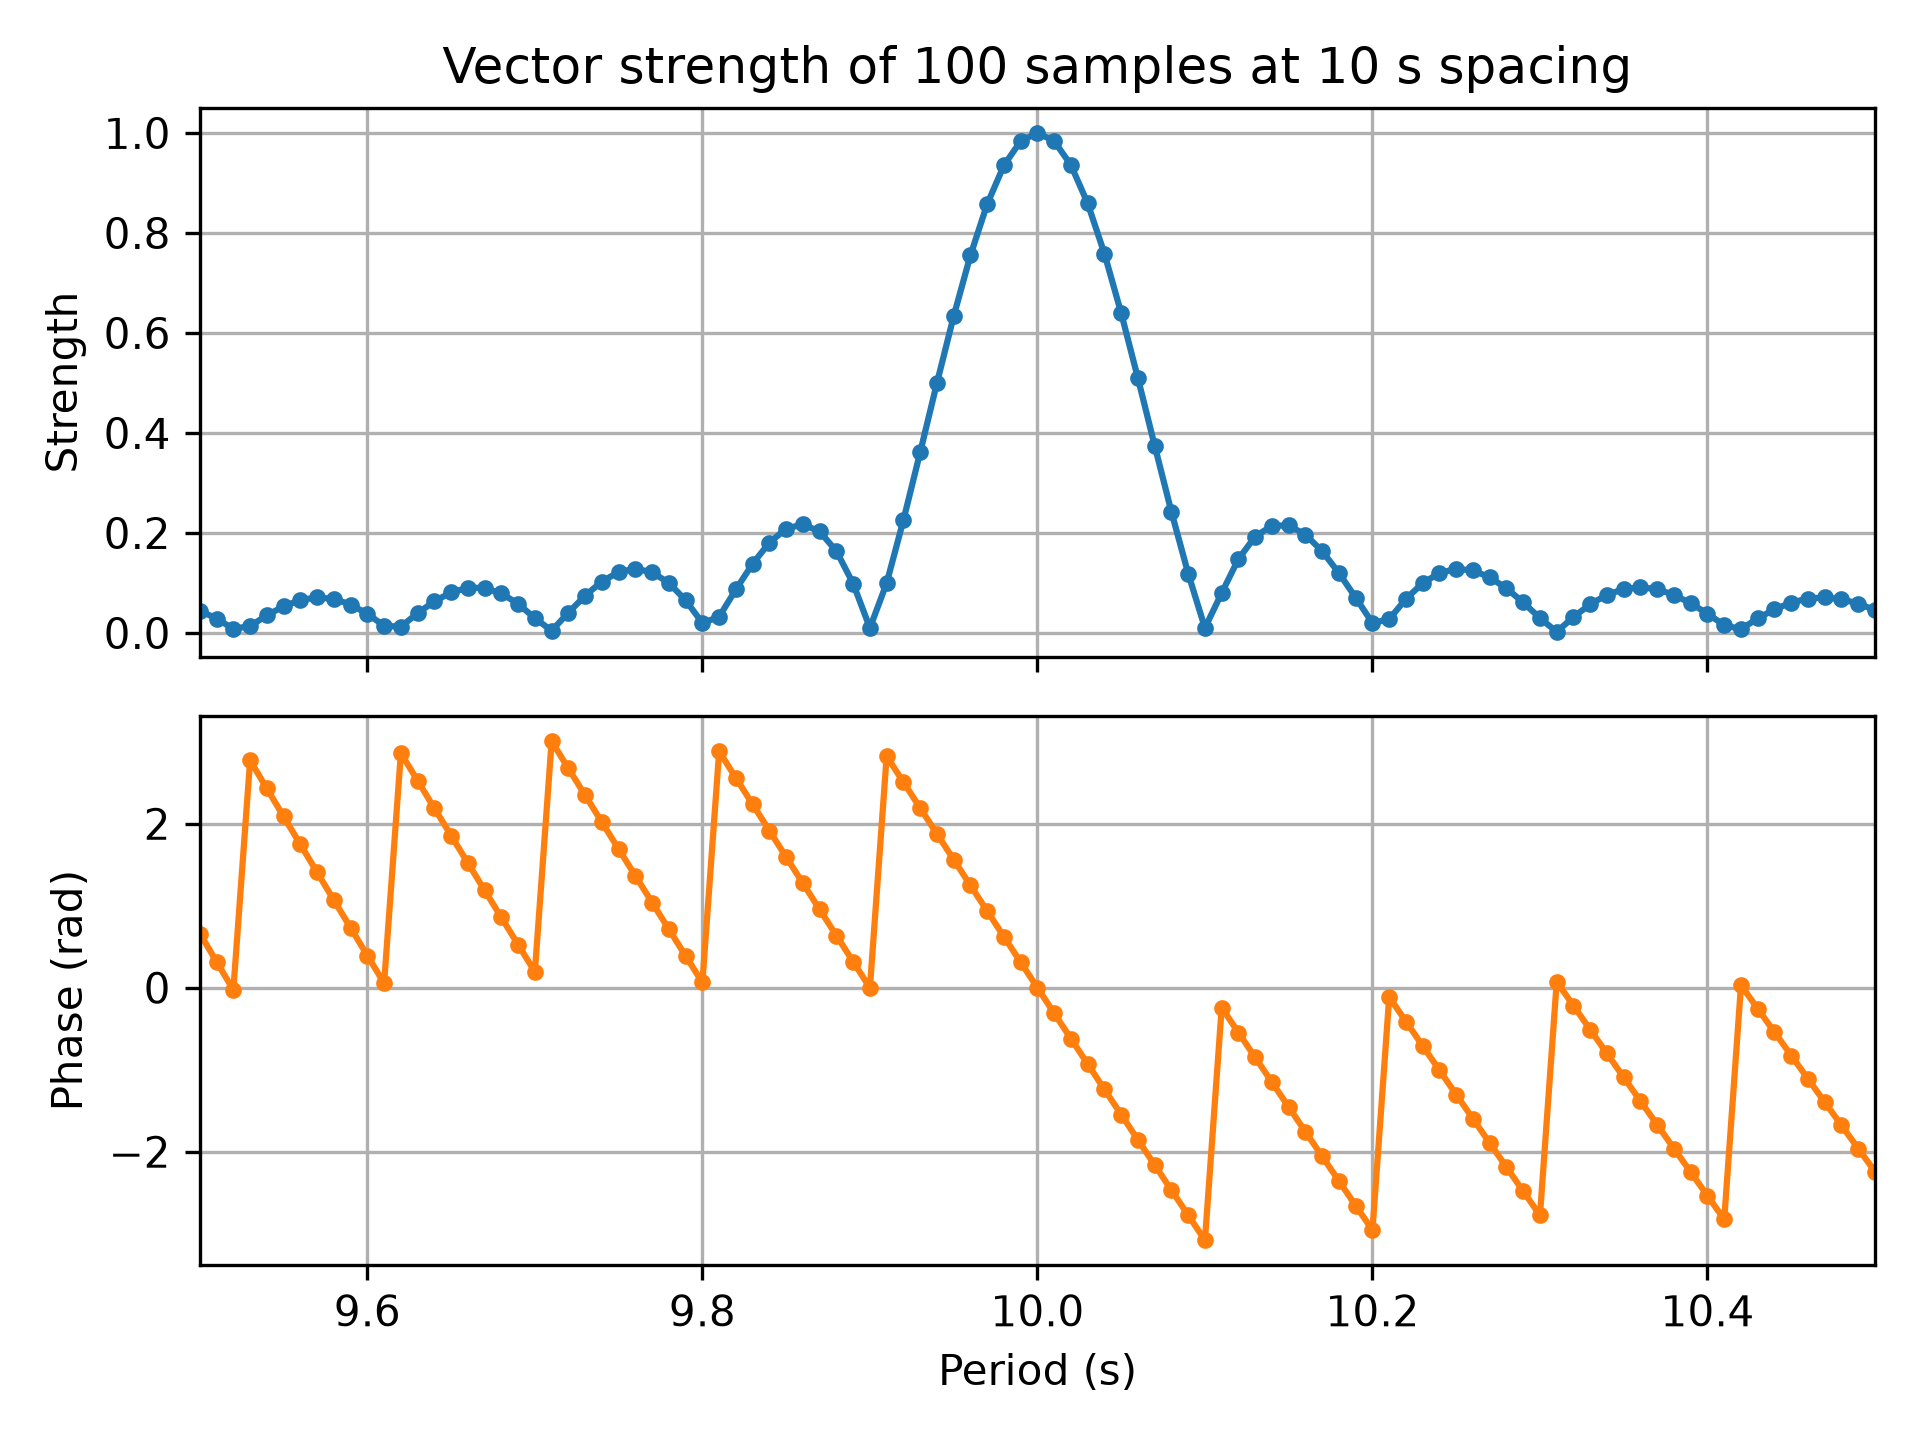
The following example depicts the vector strength and its phase for 100 samples with a constant period of 10 s. The maximum strength of 1 occurs at 10 s with phase 0 rad. Due to the finite number of samples, the strength does not drop to zero away from 10 s but exhibits secondary maxima similar to those of an FFT sidelobe pattern. The phase decreases roughly linearly with jumps of π rad at each sidelobe minimum, consistent with an underlying sinc-like function.
import matplotlib.pyplot as plt
import numpy as np
from scipy.signal import vectorstrength
N, T = 100, 10  # samples and sampling interval in seconds
events = np.arange(N) * T
periods = np.linspace(9.5, 10.5, 101)
strength, phase = vectorstrength(events, periods)
fig, (ax_strength, ax_phase) = plt.subplots(
    2, 1, sharex=True, tight_layout=True)
✓
ax_strength.set_title(
    f"Vector strength of {N} samples at {T} s spacing")
ax_strength.set(ylabel="Strength", xlim=(periods[0], periods[-1]))
✗
[Text(0, 0.5, 'Strength'), (9.5, 10.5)]
ax_strength.grid(True)
✓ax_phase.set(xlabel="Period (s)", ylabel="Phase (rad)")
✗[Text(0.5, 0, 'Period (s)'), Text(0, 0.5, 'Phase (rad)')]
ax_phase.grid(True)
✓ax_strength.plot(periods, strength, 'C0.-') ax_phase.plot(periods, phase, 'C1.-')✗
[<matplotlib.lines.Line2D object at 0x7f3f60e623c0>]
plt.show()
✓
Aliases
scipy.signal.vectorstrength